In this RStudio project I used ggplot to create complex data visualizations, demonstrating proficiency in coding and data analysis. Through a step-by-step process, I developed visualizations that highlight relationships between multiple variables, effectively communicating insights from the data.
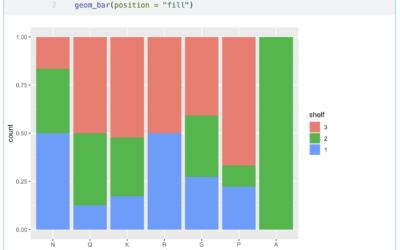
Quantitative Data Visualization with RStudio
read more